
Market structure · Pine Script v6
Downloads —
CVD Divergence+
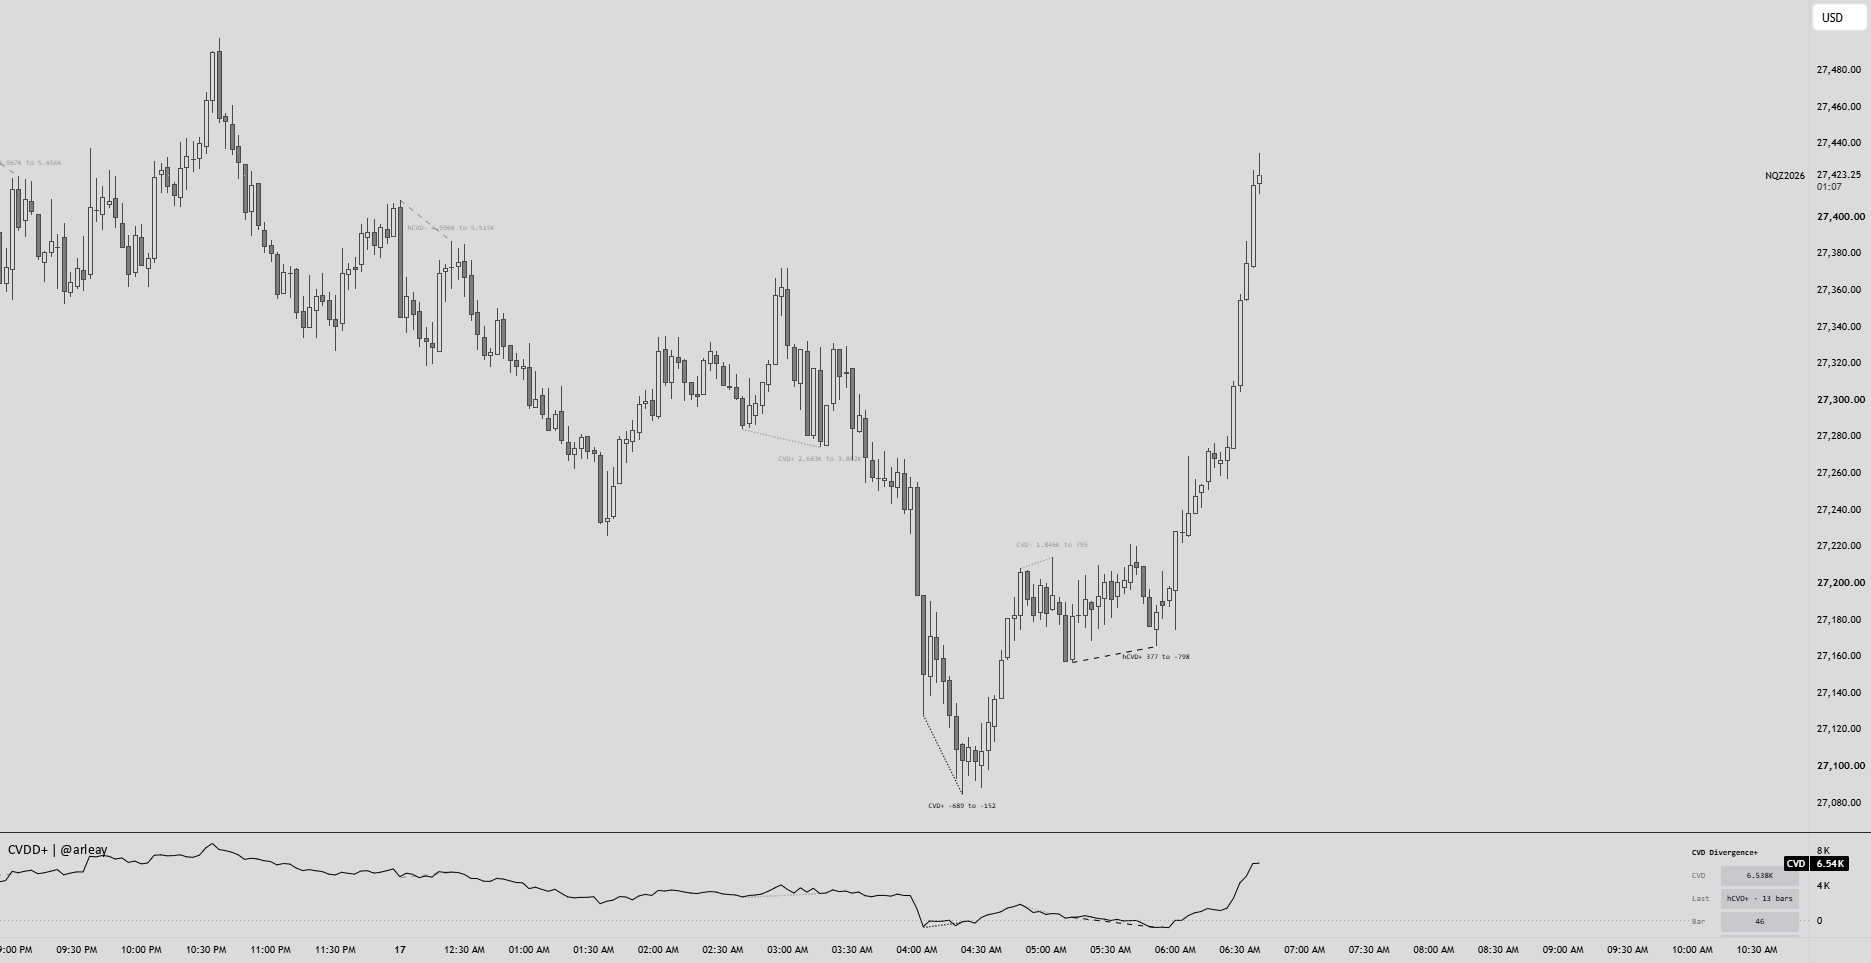
Plots an estimated cumulative volume delta (CVD) in its own pane and marks swing highs and lows where price and CVD disagree, on both the price chart and the CVD pane.
Overview
CVD Divergence+ plots an estimated cumulative volume delta (CVD) in its own pane and marks swing highs and lows where price and CVD disagree. When price makes a higher high but CVD makes a lower high, the move up was not backed by the same net buying. When price makes a lower low but CVD makes a higher low, the move down was not backed by the same net selling. Each divergence is drawn on both the price chart and the CVD pane, and dropped once price moves past it.
How it works
Each 1 minute bar inside the chart bar counts all of its volume as buying if it closed above its open, and as selling if it closed below. The chart bar’s delta is the sum of those values, and CVD is the running total. It resets each trading day by default, with weekly and no reset also available. Where 1 minute history is not available, the chart bar itself is classified the same way, and the panel shows which source is in use. This is an estimate built from bar direction, not tick data, bid/ask volume or footprint data.
A swing high or low needs 5 bars on the left and 3 on the right, so it is only known once the 3 right-side bars have closed. Each new pivot is compared with the previous pivot of the same kind using CVD at the two pivot bars.
- Regular bearish (CVD-): price higher high, CVD lower high.
- Regular bullish (CVD+): price lower low, CVD higher low.
- Hidden bearish (hCVD-), off by default: price lower high, CVD higher high.
- Hidden bullish (hCVD+), off by default: price higher low, CVD lower low.
The two pivots must be within 80 bars, at least 4 ticks apart in price and at least 1.0x the 50 bar average of absolute bar delta apart in CVD. A divergence ends when price trades past its second pivot. In Minimal view it is removed; in Full view it stays, faded. Once a mark is printed it does not move, and everything is calculated on closed bars with no lookahead.
Features
- Estimated CVD from 1 minute bars, with chart-bar fallback, and session, weekly or no reset.
- Regular divergences, with hidden divergences as an option.
- Lines joining both pivots on the price chart and matching lines on the CVD pane.
- Compact CVD- / CVD+ tags at the second pivot, with a hover tooltip and an optional CVD change.
- Divergences removed or faded once price trades past them, with a display cap that removes the oldest whole.
- Minimum price, CVD and span filters, and optional bar delta columns.
- Compact panel with CVD, last divergence and its age, bar delta and data source.
- Bearish and bullish alerts on closed bars.
How to use
Use it on futures or stock charts from 1 to 15 minutes, on symbols that report volume. A CVD- or CVD+ tag means delta did not confirm the new price extreme. The line on the CVD pane shows how far apart the two readings were, and a divergence that disappears or fades means price has already moved past it. Check the Data row in the panel: “chart bars” means 1 minute history is not available for that bar and the estimate is at its coarsest.
Alerts
CVD Divergence — Bearish and CVD Divergence — Bullish each fire once on the closed bar where a divergence is confirmed, which is 3 bars after the pivot with the default settings.
Limitations
- Delta is inferred from whole-bar direction, so a 1 minute bar with heavy buying that closes down counts entirely as selling.
- 1 minute history is limited by TradingView; older bars fall back to chart-bar classification.
- Marks arrive 3 bars after the pivot by default, and only consecutive pivots of the same kind are compared.
- With a reset on, a divergence that spans two periods is not marked.
- Symbols without volume data show a flat CVD and no divergences.
- Not suitable for Heikin Ashi, Renko, Kagi, Point and Figure, Line Break or Range charts.
Tips
- Raise Min CVD difference to 2 or more to keep only wide disagreements.
- Raise the pivot bars for swing-level marks, lower them for faster intraday marks.
- Set Reset to None to allow divergences across the session boundary.
- Turn on Hidden only when you want continuation context, since it adds marks quickly.
- Use Full view to review how past divergences played out.
This is a context tool, not financial advice and not a trading signal.