
Market structure · Pine Script v6
Downloads —NEW*
Developed Volume Profile Plus
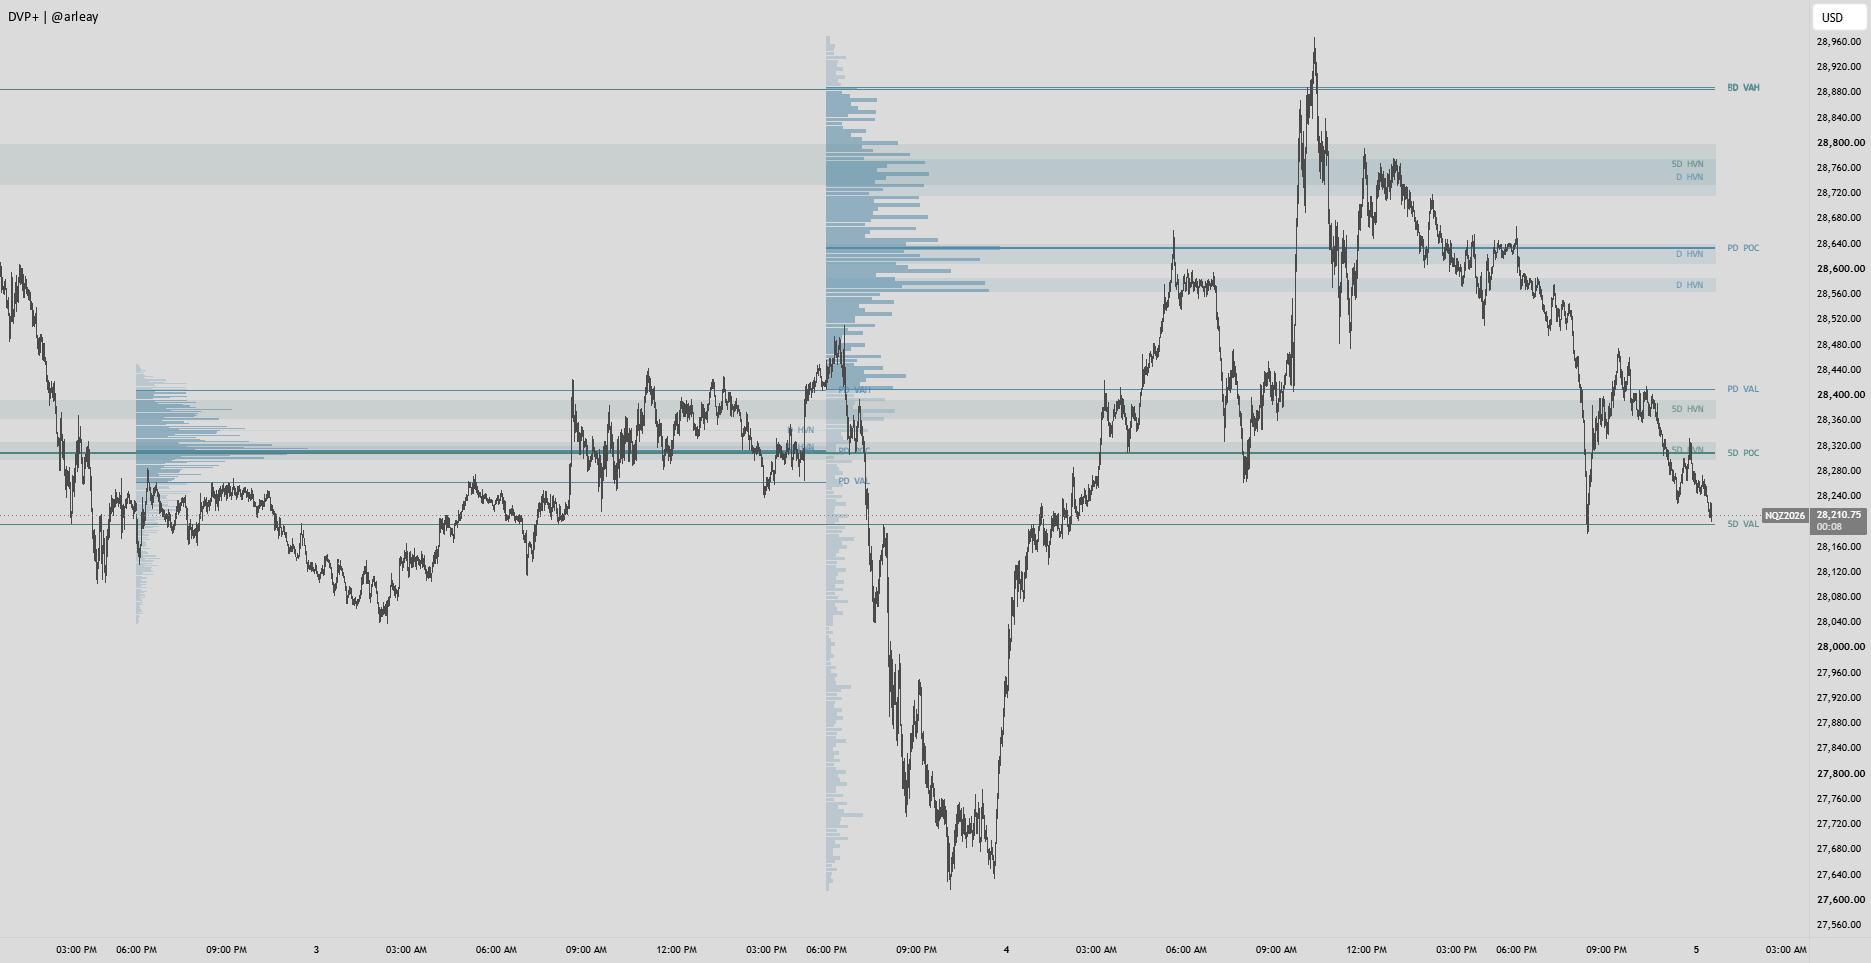
Builds completed-session volume profiles with POC, value-area levels and high-volume-node zones.
How it works
Developed Volume Profile Plus
Compare prior periods and rolling completed sessions for volume context. Profiles estimate volume placement from one-minute bars and do not generate entries.
Overview
Developed Volume Profile Plus maps volume from completed periods, showing the point of control (POC), value-area high and low, and high-volume-node zones. Compare the previous day, week or month with rolling profiles of 5, 20 or 30 completed sessions. The active session is excluded.
How it works
Profiles use one-minute source bars grouped into futures sessions ending at 17:00 New York time. Each minute's volume is spread across price bins within its high-low range, then combined into the selected completed period. This estimates volume placement from OHLCV data; it is not tick-level trade data or bid/ask order flow.
The largest volume row marks POC. A contiguous value area covers 70% of volume by default. Smoothed volume peaks identify high-volume nodes, with up to three strong, non-overlapping zones retained. Profile resolution, value area and node thresholds are adjustable.
Features
- Previous-day and 5-session profiles enabled by default; previous week, month and longer rolling windows available independently.
- Separate histogram, POC/value-area and node-zone controls, with colors, transparency, labels and width settings.
- Histograms anchored to the source period, darker value-area rows and solid level lines extending toward current price.
- Daily and weekly history controls, optional older-level extension and adjustable session retention.
How to use it
Use a standard intraday chart of one minute or higher. Start with the default daily and 5-session views, then enable other periods when enough history is loaded. Compare concentrated-volume zones and value-area boundaries as context for a separate trading process. Reset saved indicator inputs when upgrading to use the revised defaults.
Important details
Profiles appear only after their period completes. Their historical anchor does not mean those levels were known during that period. Higher chart timeframes consume minute data on confirmed chart bars, so publication can be delayed until that bar closes. Initial partial sessions and incomplete first weeks or months are withheld.
Available one-minute history depends on TradingView data and plan limits. Longer profiles need sufficient completed sessions; no holiday calendar is queried. This is an independent implementation inspired by a protected publication, with inferred calculations and styling. Exact numerical or visual parity is not claimed. It provides no entries, stops, targets or alerts. This uploaded build has not been compiled or chart-tested here.