
Market structure · Pine Script v6
Downloads —NEW*
DOL Map+
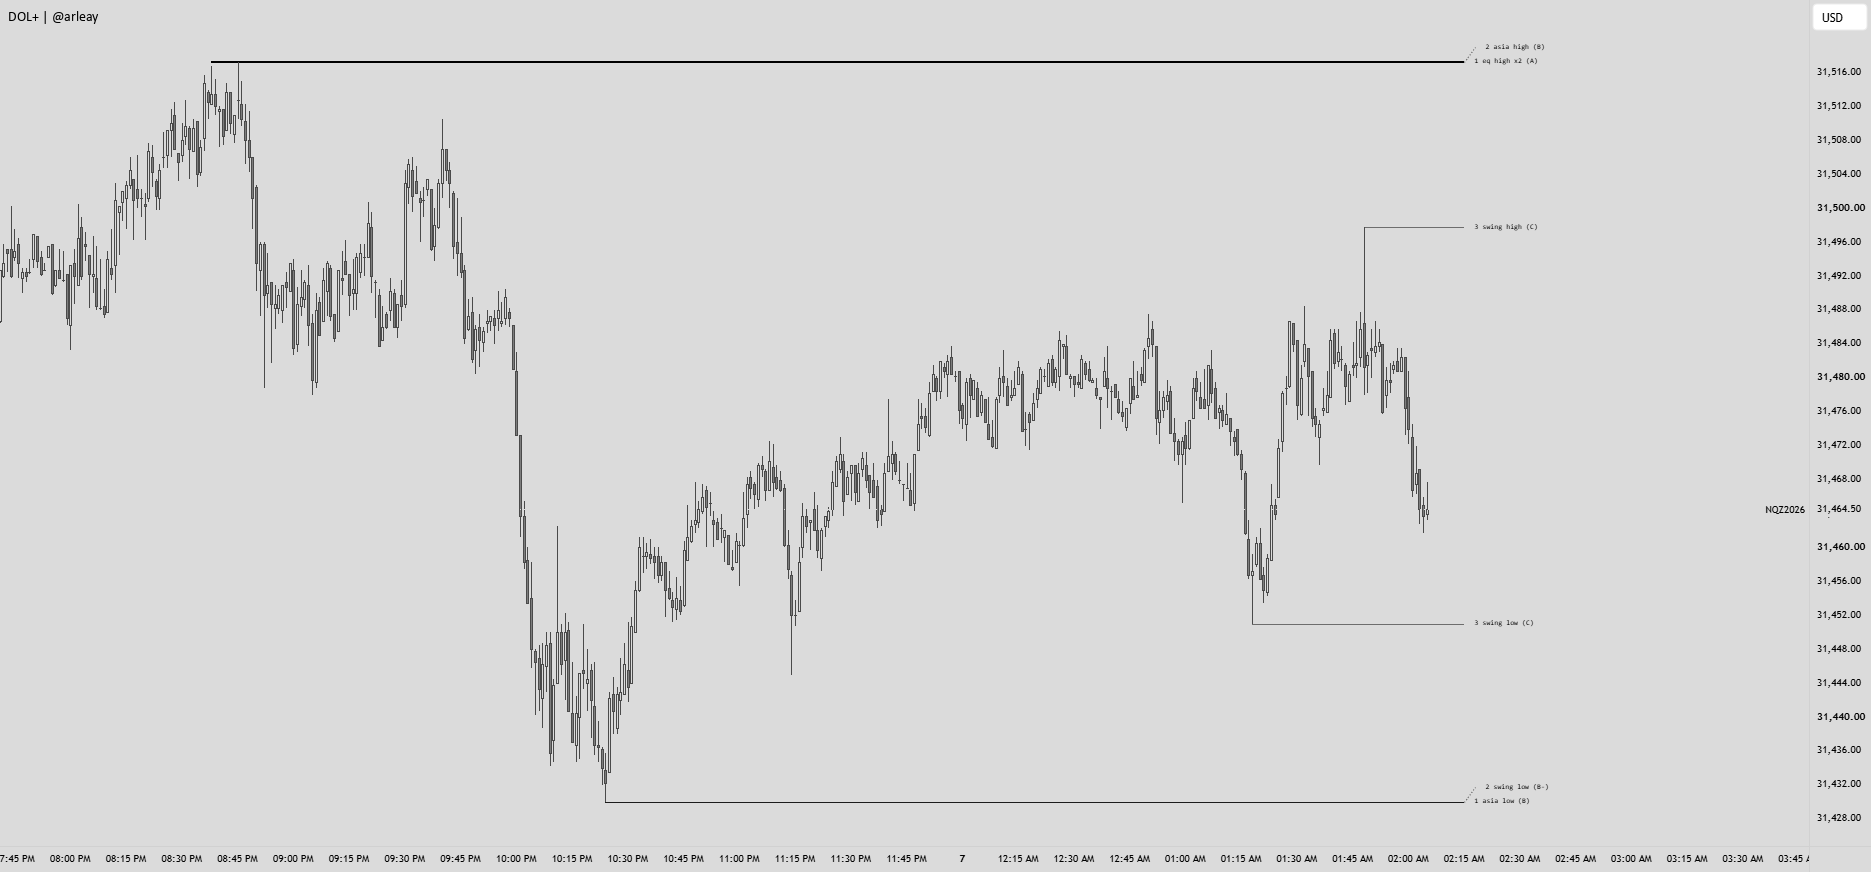
Ranks session and prior-period highs/lows, confirmed swings, and equal levels, then tracks sweeps, runs, and paired-level research stats.
How it works
DOL Map+
Use on 1–5 minute NQ/MNQ charts in New York time. Treat pool ranks and Fuel as mapped context, not entries or forecasts.
How it works
DOL Map+ builds a map from configured session highs and lows for Asia, London, NY AM and NY PM; completed previous-day and previous-week highs and lows; confirmed swing highs and lows; and equal highs and lows. Equal levels use a configurable tolerance, with perfect equals within one tick. Optional 08:30, 10:00 and 14:00 data candles qualify only when their range is at least 2.5 ATR.
Pool ranking
Each pool receives a base tier from C to S. Nearby pools on the same side can add one tier, up to S. The display score is tier × 10 − distance in ATR × the distance weight. Pools are ranked separately above and below price; up to three can show on each side. The Fuel row reports Up, Down, Both sides or None for the selected tier and distance. These settings are ranking heuristics, not proven probabilities or a forecast.
Sweeps and research
When price trades through a pool, a close back inside marks it swept; a close beyond marks it run. Ended pools can remain as dashed segments, subject to the display limit. Swing highs and lows confirm with a delay, so they can appear later and differ across chart timeframes.
For each qualifying new pool, the research panel records whether price reaches it within the chosen horizon and whether price reacts after a touch. A paired control level is offset closer or farther in alternating order. The panel compares reach and reaction rates with sample counts; rows are muted when either sample has fewer than 30 events. These historical rates describe the selected sample, not future odds.
Getting started
Use standard time-based NQ or MNQ charts on a 1–5 minute interval with New York time. Choose which level types to display, then adjust tier and distance filters to suit the chart.
Important details
Results depend on the loaded chart history and selected controls. Confirmed swings are delayed and may vary by timeframe. DOL Map+ is a context overlay: it does not provide entries, place orders, send alerts, or establish that a pool will be reached.