
Market structure · Pine Script v6
Downloads —!Downloads for this indicator weren't being recorded until November 16, 2026, so this count is lower than the real total.
LRLR+
Marks low resistance liquidity lines: shallow trendlines through three or more swing highs or lows, drawn as a map with no entries or alerts.
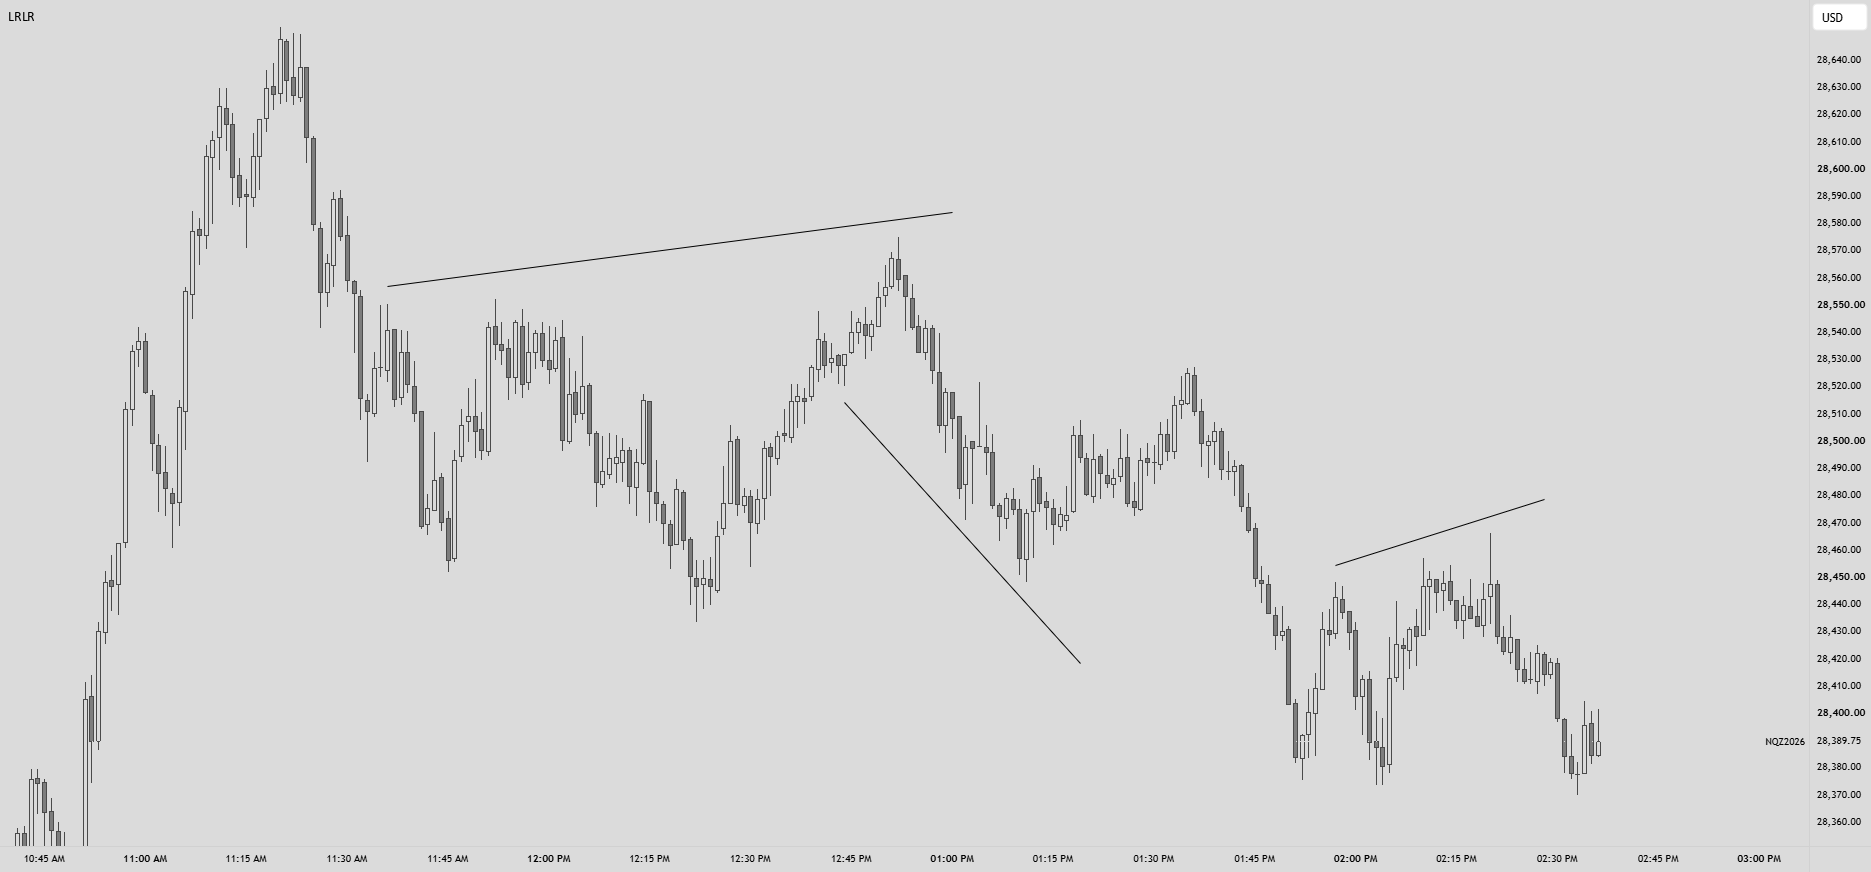
Overview
LRLR+ marks low resistance liquidity lines on the chart. These are trendlines through several swing highs or swing lows that form a shallow ramp. The idea is that once the first stop behind the line is taken, the rest tend to trigger quickly, so the start of the line is often a target for price.
It only draws lines. There are no entries, signals or alerts, so it works as a map to trade around with your own entry model.
How it works
Swing highs and lows are found on the current chart. A line needs at least three touches by default, and two-touch lines are ignored. Lines that are too steep are skipped, because a ramp is shallow rather than vertical. Each line runs from the first touch to a few bars past the last touch and floats slightly off the wicks, like a hand-drawn line. Highs lines and lows lines can slope either way.
When a bar closes through a line, the line is removed by default. A setting keeps broken lines, up to a chosen number.
Features
- Swing strength, minimum touches, touch distance in ATR and maximum slope.
- Highs, lows or both, with a cap on live lines per side and a lifetime in days.
- Show only the newest 1, 2, 3, 4 or all lines at once; hidden lines are still tracked.
- Adjustable extension past the last touch and float distance from the wicks.
- Optional broken lines, plus line color, width and style.
Important details
Lines are found automatically, so they will not match hand-drawn lines exactly. Calculations use closed bars, so a line is never drawn from a bar that is still forming. It is not meant for Heikin Ashi, Renko, Kagi, Point and Figure, Line Break or Range charts. This is a drawing tool, not financial advice and not a trading signal.