
Price action · Pine Script v6
Downloads —NEW*
Swift Algo X
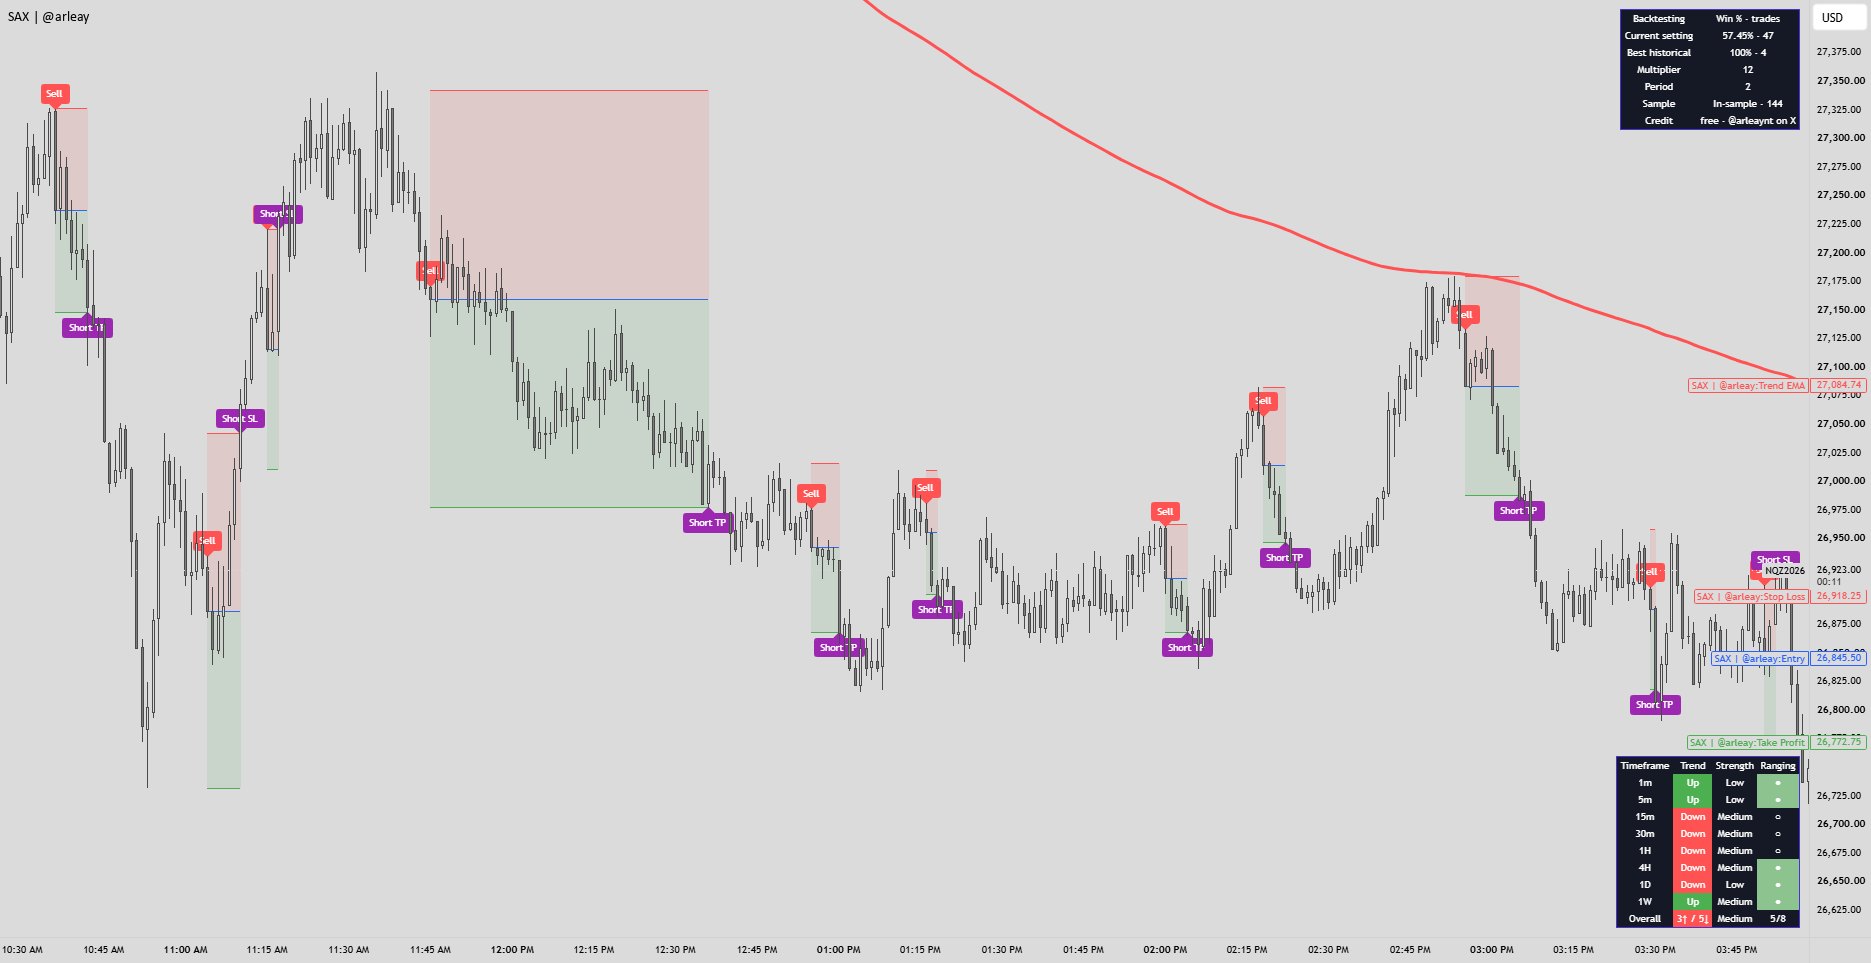
Combines volume-weighted momentum signals, entry and exit levels, a parameter comparison dashboard, and an eight-timeframe trend panel.
How it works
Swift Algo X
Use standard candles on a symbol with volume data. Set Indicator Sensitivity above your chart timeframe.
How it works
The indicator weights each candle’s directional range by volume and measures changes in that pressure using two EMAs. It normalizes their difference by recent volatility and projects it onto price to build a trailing ATR band. Buy and Sell labels appear on confirmed closes through the band when the enabled EMA filters agree.
Each signal uses the candle close as the entry, a recent high or low as the stop, and your selected reward-to-risk ratio to calculate the target. Red and green shading show the risk and reward areas. TP and SL labels mark simulated outcomes.
Dashboards
Backtesting compares your current settings with 144 multiplier and period combinations. It shows historical win rates and closed-trade counts. You can apply any setting changes manually.
Trend summarizes direction, strength, and ranging conditions across eight timeframes from 1 minute to 1 week.
Getting started
Use standard candles on a symbol with volume data. Set Indicator Sensitivity above your chart timeframe. For example, use 30-minute sensitivity on a 5-minute chart.
The optimizer ranks settings on the same historical sample it tests. Results exclude fees and slippage. Win rate alone doesn’t establish profitability.