
Market structure · Pine Script v6
Downloads —
True FVG+
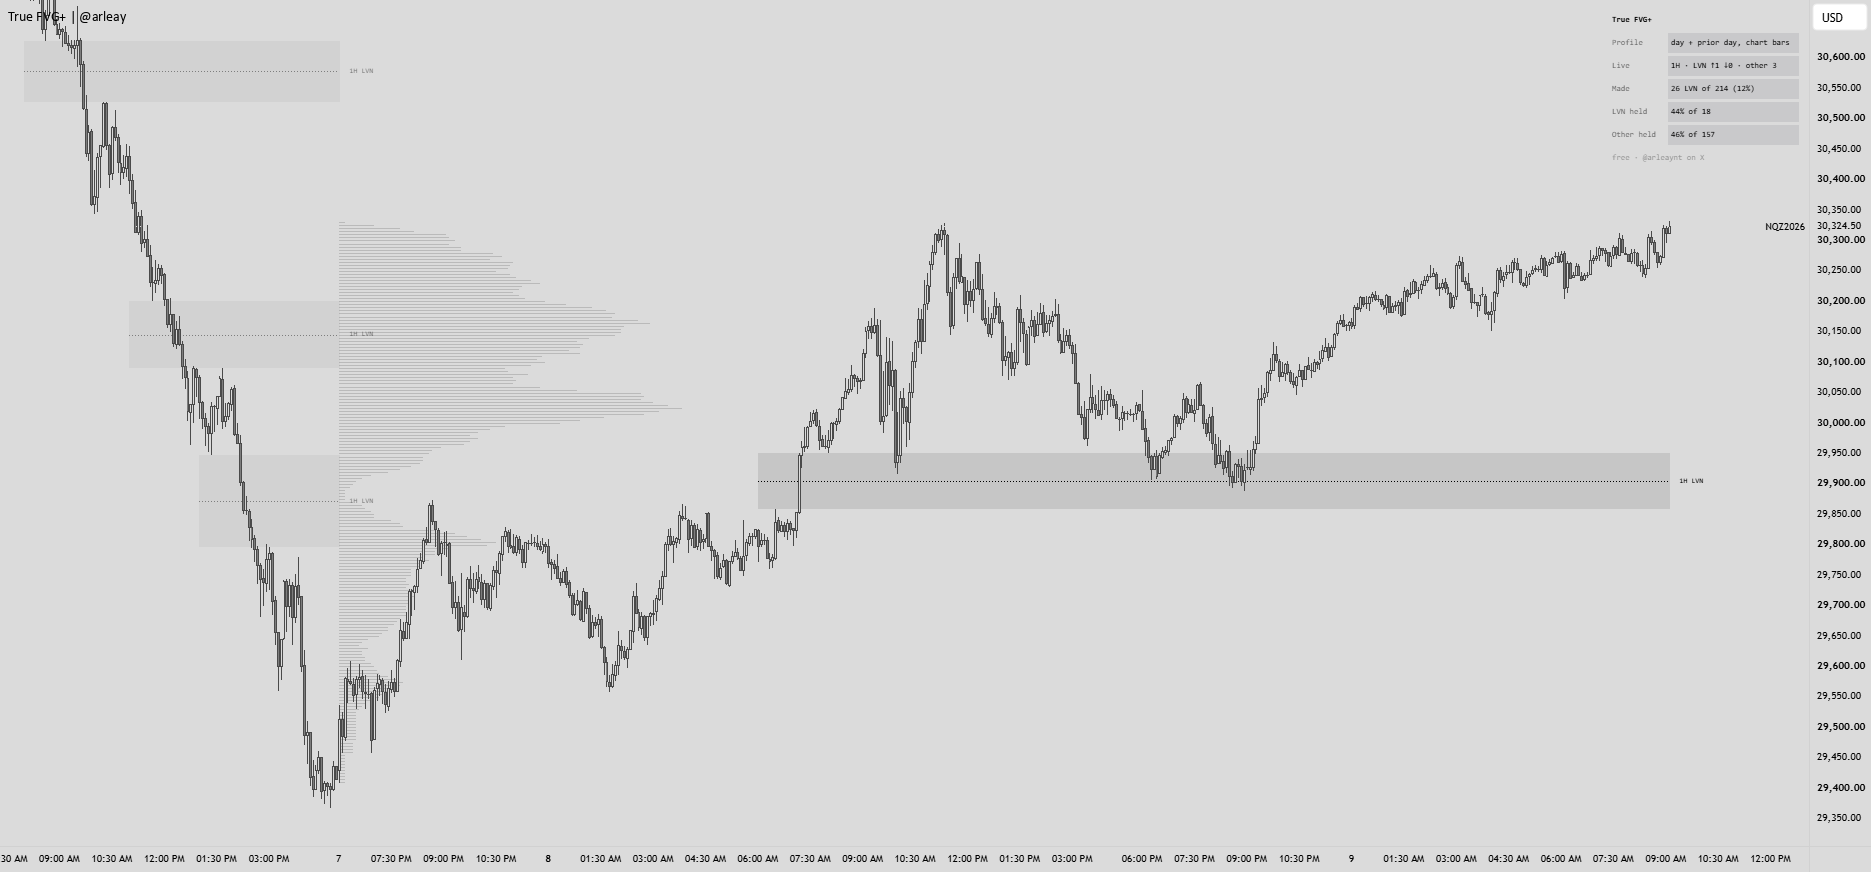
Fair value gaps that are also low volume nodes on the volume profile. Gaps that pass the LVN test are drawn and tagged, and a panel tracks how often they held compared with gaps that failed it.
Overview
True FVG+ marks fair value gaps and keeps only the ones that are also low volume nodes on the volume profile. A three-candle gap shows that price skipped a range on the chart. The volume profile shows whether that range was actually thin, or whether it already held heavy volume from earlier trading. A gap that passes both checks is drawn and tagged LVN.
It is an overlay indicator. It does not place orders, manage risk or produce a strategy report. An LVN tag marks that a defined volume condition was met on the bar the gap formed. It is not a buy or sell recommendation and does not imply future results.
How it works
- Gap. Bullish: the low of the third candle is above the high of the first. Bearish: the high of the third is below the low of the first. Minimum size 2 ticks. It is tested once, on the close of the third candle, and the result does not change afterwards.
- Profile. Volume is stored by price row. Each 1 minute bar spreads its volume evenly over its own high-low range, with a chart-bar fallback where 1 minute history is missing. Row size is about 0.005% of price. The default profile is the current trading day plus the prior one. Day only and week plus prior week are also available.
- LVN test. Gap density is the profile volume inside the gap divided by its height. Local test: it must be 50% or less of the thinner of the heaviest volume per price above and below the gap. Overall test: it must be 50% or less of the profile's average volume per price. By default both must pass, or choose Local only or Overall only.
- Aligned HTF mode. Reads gaps from the higher timeframe paired with the chart (1m to 15m, 5m to 1H, 15m to 4H, 1H to D and so on). Only closed higher timeframe candles are read, and the profile scales with the gap.
- Life of a gap. A gap stays live until a candle closes past its far edge, or 48 hours pass. Touched means a later bar trades into it. Held means price then moves 1 times the 14-bar ATR away from it. Failed means it ended before that move.
What you see
- LVN gaps as boxes with a tag and a CE line. Hover for both ratios, their limits, the profile used and the outcome.
- Full view also shows gaps that failed the test, faded, with the reason in the tooltip.
- Optional historical LVN gaps, faded, up to 100 per side.
- An optional profile histogram anchored at the profile start.
- A panel with the profile in use, live gaps, the share of gaps that pass, and held rates for LVN gaps and other gaps with sample sizes.
Settings
- Gaps: min gap, gap ends on, max age, gap timeframe.
- Validation: profile, 1m bar profile, validate with, local and overall limits, side window, row size, aligned profile.
- Stats: held after. Display: view, gaps per side, CE line, tags, ratio in tag, historical gaps.
- Style, panel and profile display options for every drawing.
Alerts
- True FVG Bullish and True FVG Bearish: once on the closed bar where an LVN gap forms.
- True FVG Touched: on the closed bar that first trades into a live LVN gap.
Notes
- Use it on futures or other symbols that report volume, on 1 to 15 minute charts.
- Volume is an estimate spread over each 1 minute range, not tick, bid/ask or footprint data. Older bars use chart-bar volume, which is coarser.
- The held rate uses a fixed ATR distance and compares the two groups of gaps. It is not a trade result. Check the sample size before reading anything into it.
- Not suitable for Heikin Ashi, Renko, Kagi, Point & Figure, Line Break or Range charts.
- This is a free script and nothing here is financial advice.