
Market structure · Pine Script v6
Downloads —NEW*
TZoneIN+
Maps multi-timeframe swing zones, tracks reactions and breaks, and preserves qualifying turns as frozen zones.
How it works
TZoneIN+
Use zones as areas to watch for reactions, not automatic entry signals. Detection is independently implemented and does not reproduce private formulas.
Overview
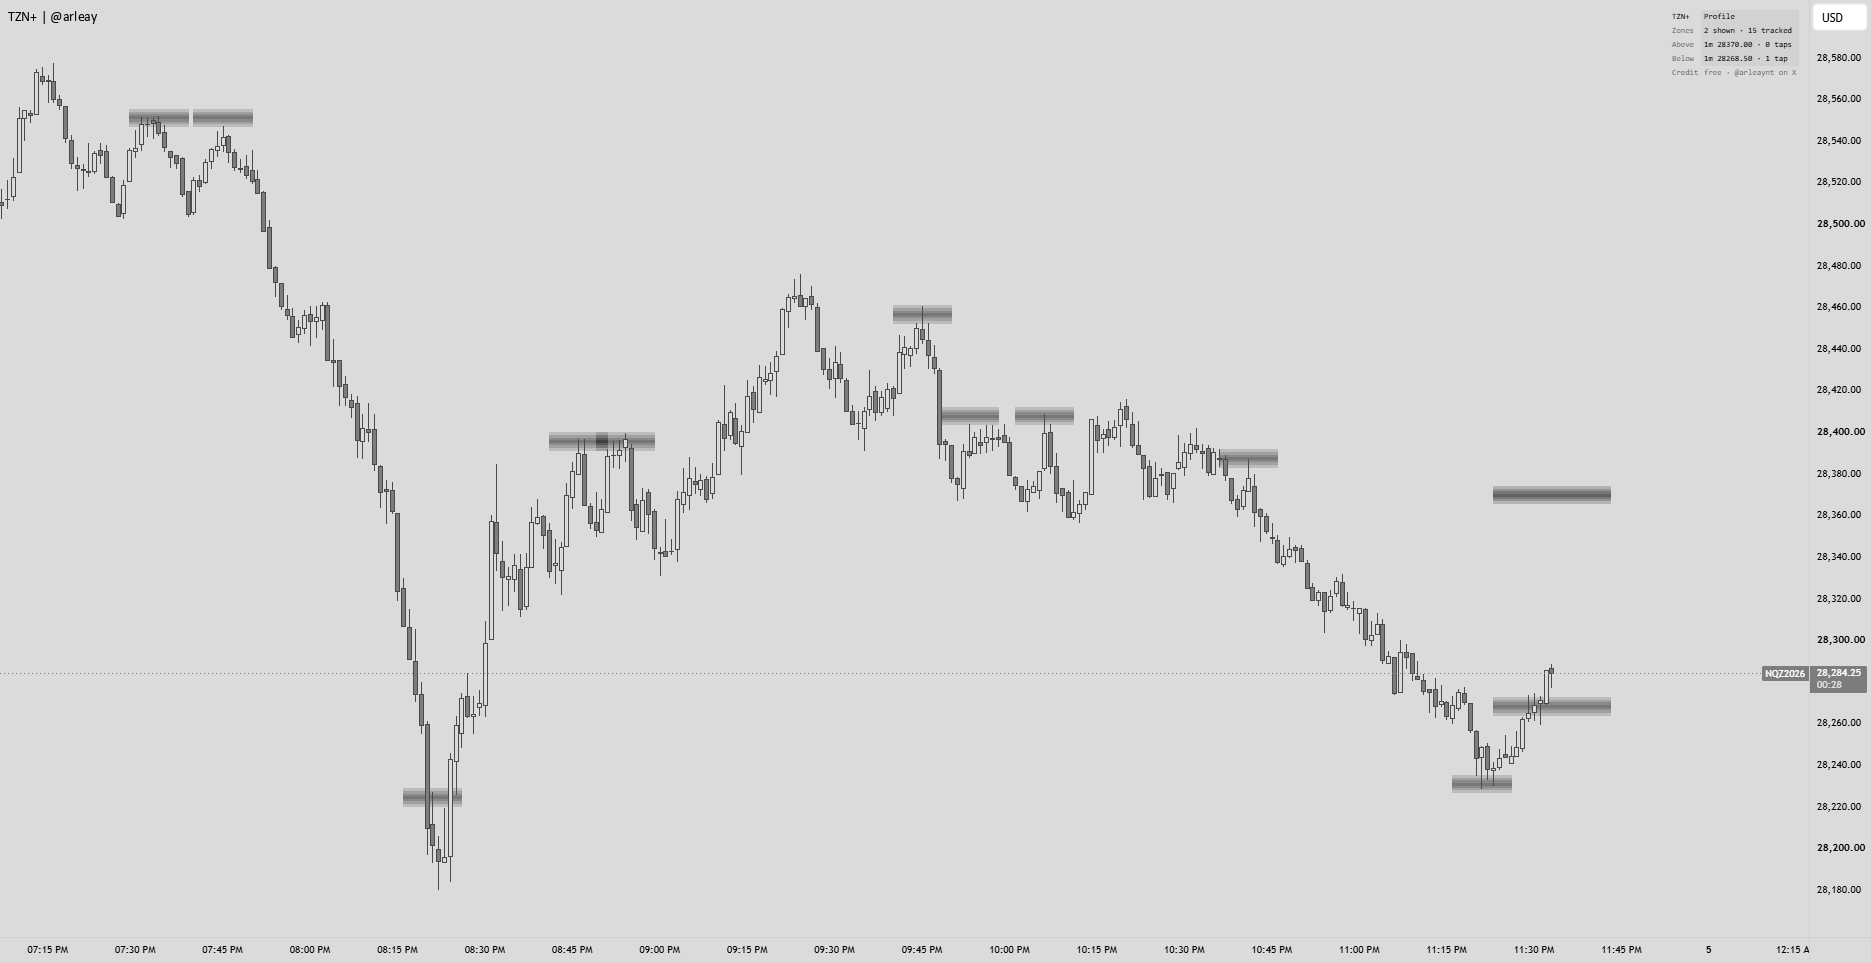
TZoneIN+ draws possible rejection zones that follow price, count taps and leave short copies where price turns inside them. It is an independent, open-source interpretation of Takumi Zones. The original detection formula is private, so exact matching is not claimed and no comparison against the original has been completed.
What you see
Live zones extend 10 candles behind and ahead of the current bar. By default, only the nearest zone above price and the nearest below are shown. Primary and secondary zones can be switched separately. Strong zones appear darker and tolerate more breaks before removal.
A tap count tracks repeated visits. A break is a close through a zone to the other side; the default removal limit is three breaks, or five for strong zones. A zone can continue working from its new side after a break, supporting break-and-retest reads. Reacted zones can be removed on their next break.
- Frozen zones preserve turns inside a zone after a bounce of at least 40 NQ points, scaled by market. Turns that overshoot the zone leave no frozen copy. Up to 10 copies are kept, each 10 candles wide.
- Optional held zones preserve the area from the tap to the turn, with up to 10 retained.
- Distance filtering hides zones beyond 500 scaled NQ points. Overlapping and nearby zones are merged for display.
- Automatic market scaling, optional tags, layer colors and opacity, and a compact panel showing tracked zones and nearest-zone tap counts.
How to use it
Start with a one-minute futures chart around the New York session. Treat zones as areas to watch and use a separate confirmation process. Enable tags to follow tap counts. For a cleaner chart, disable secondary zones or hide light zones. To show more, increase the width multiplier or change Live zones per side to two, or zero for all.
Important details
State changes are evaluated on closed bars without lookahead. The indicator provides context only: no entries, alerts, order placement or strategy report. Detection-sensitivity controls and timeframe checkboxes are not implemented, and order flow is not calculated.
Zone height, freeze-bounce distances and strength thresholds are fixed and scaled by market; ES and MES may need a larger width multiplier. Drawing capacity is approximately 480 boxes, with frozen and held zones reserved first. Use standard time-based charts. The supplied build has not been compiled or tested in TradingView here. Zones do not establish future results.