
Market structure · Pine Script v6
Downloads —
VexelPlus
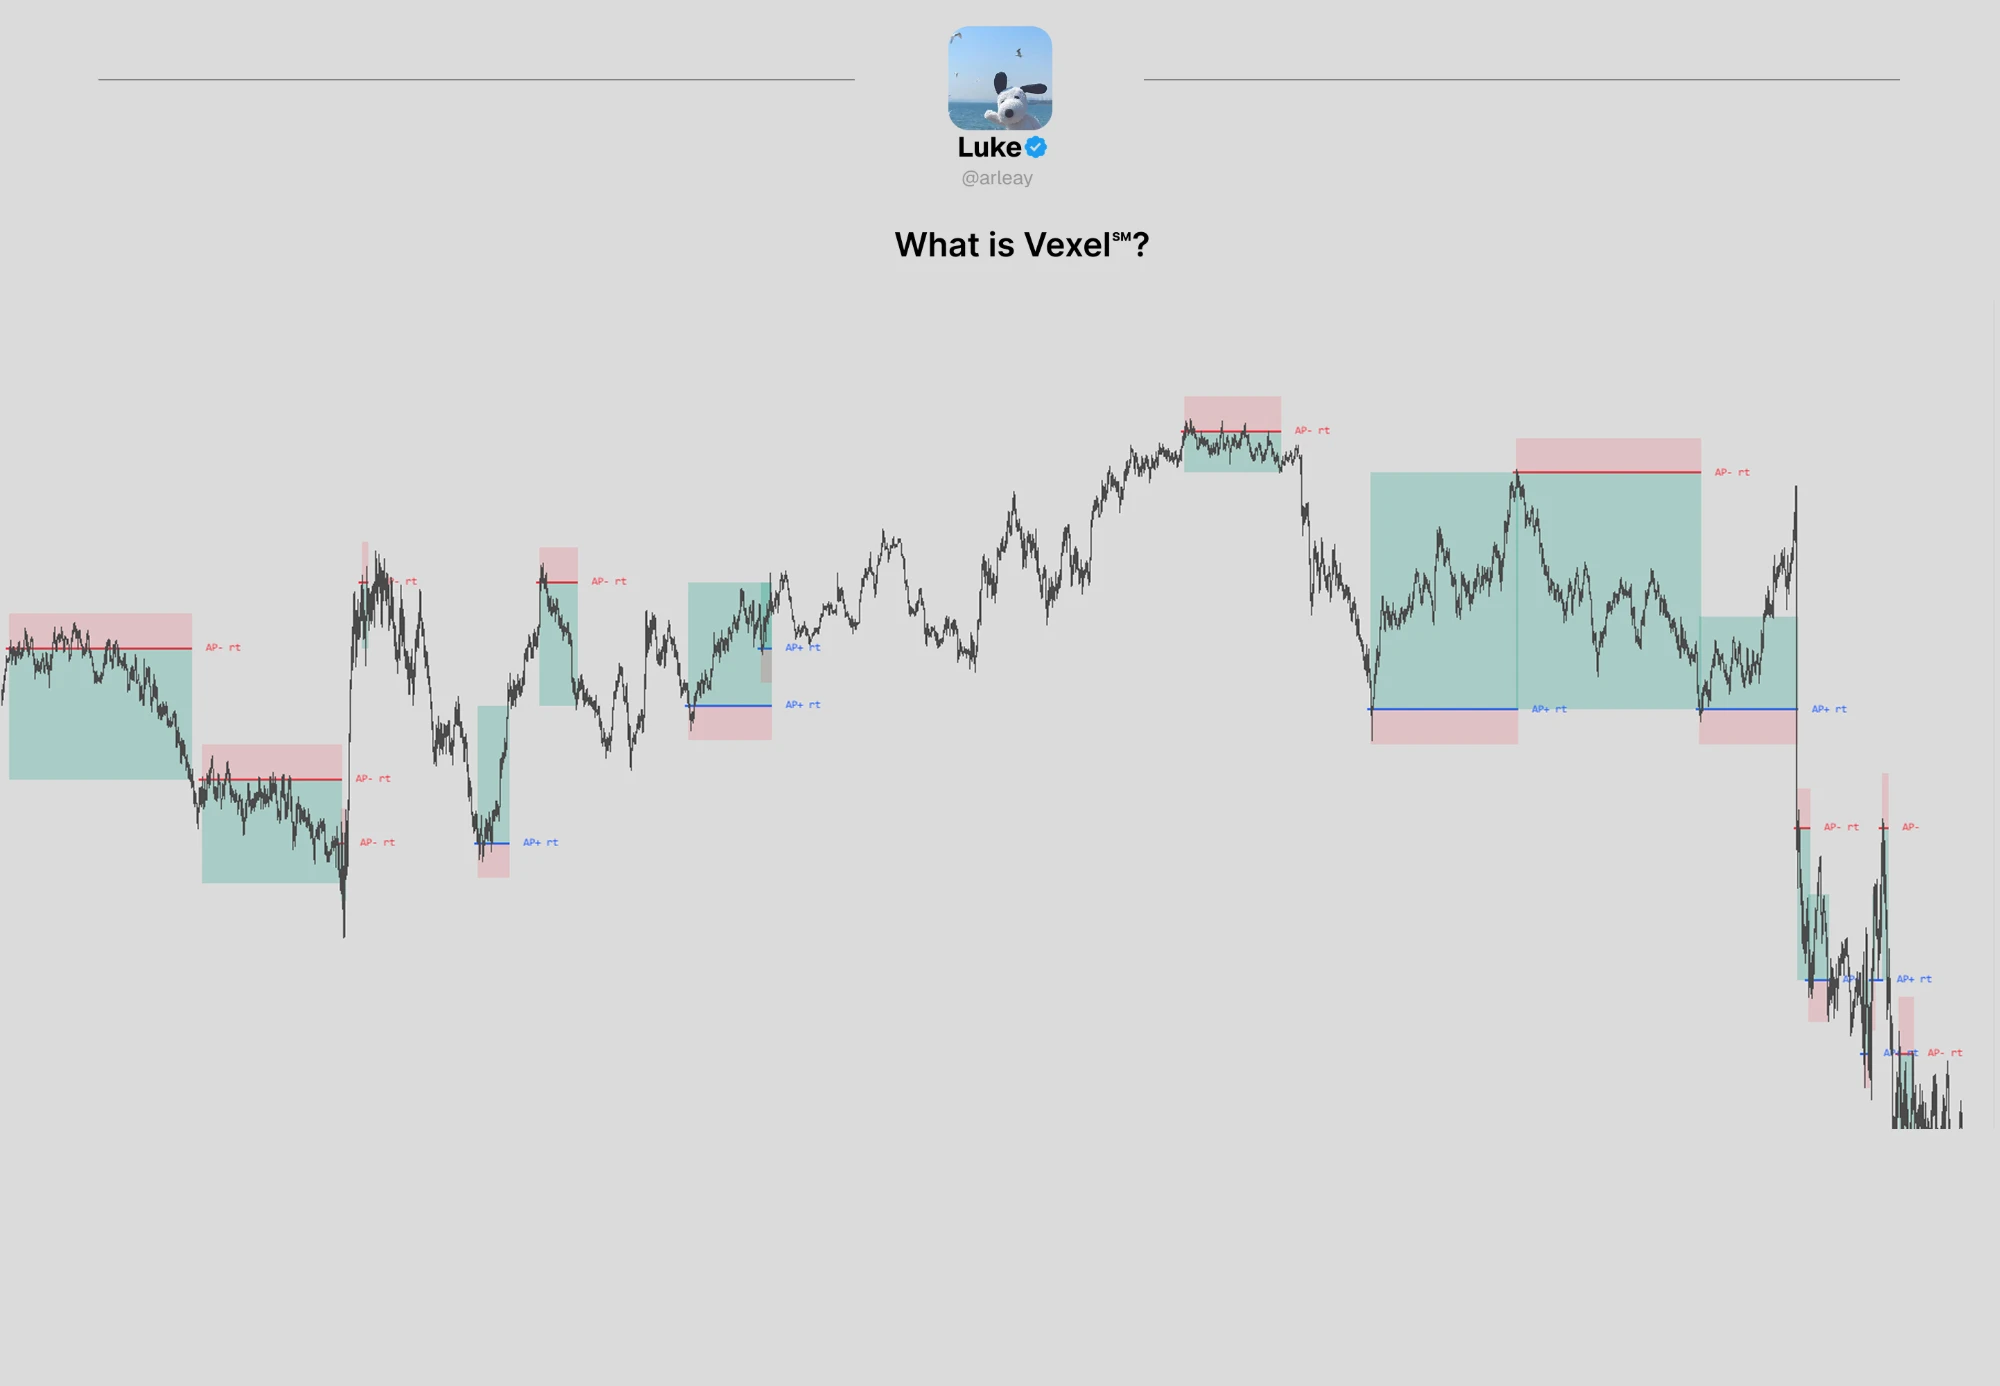
Plots a fixed map of probability-based reversal and retracement levels
Read the instructions first ↓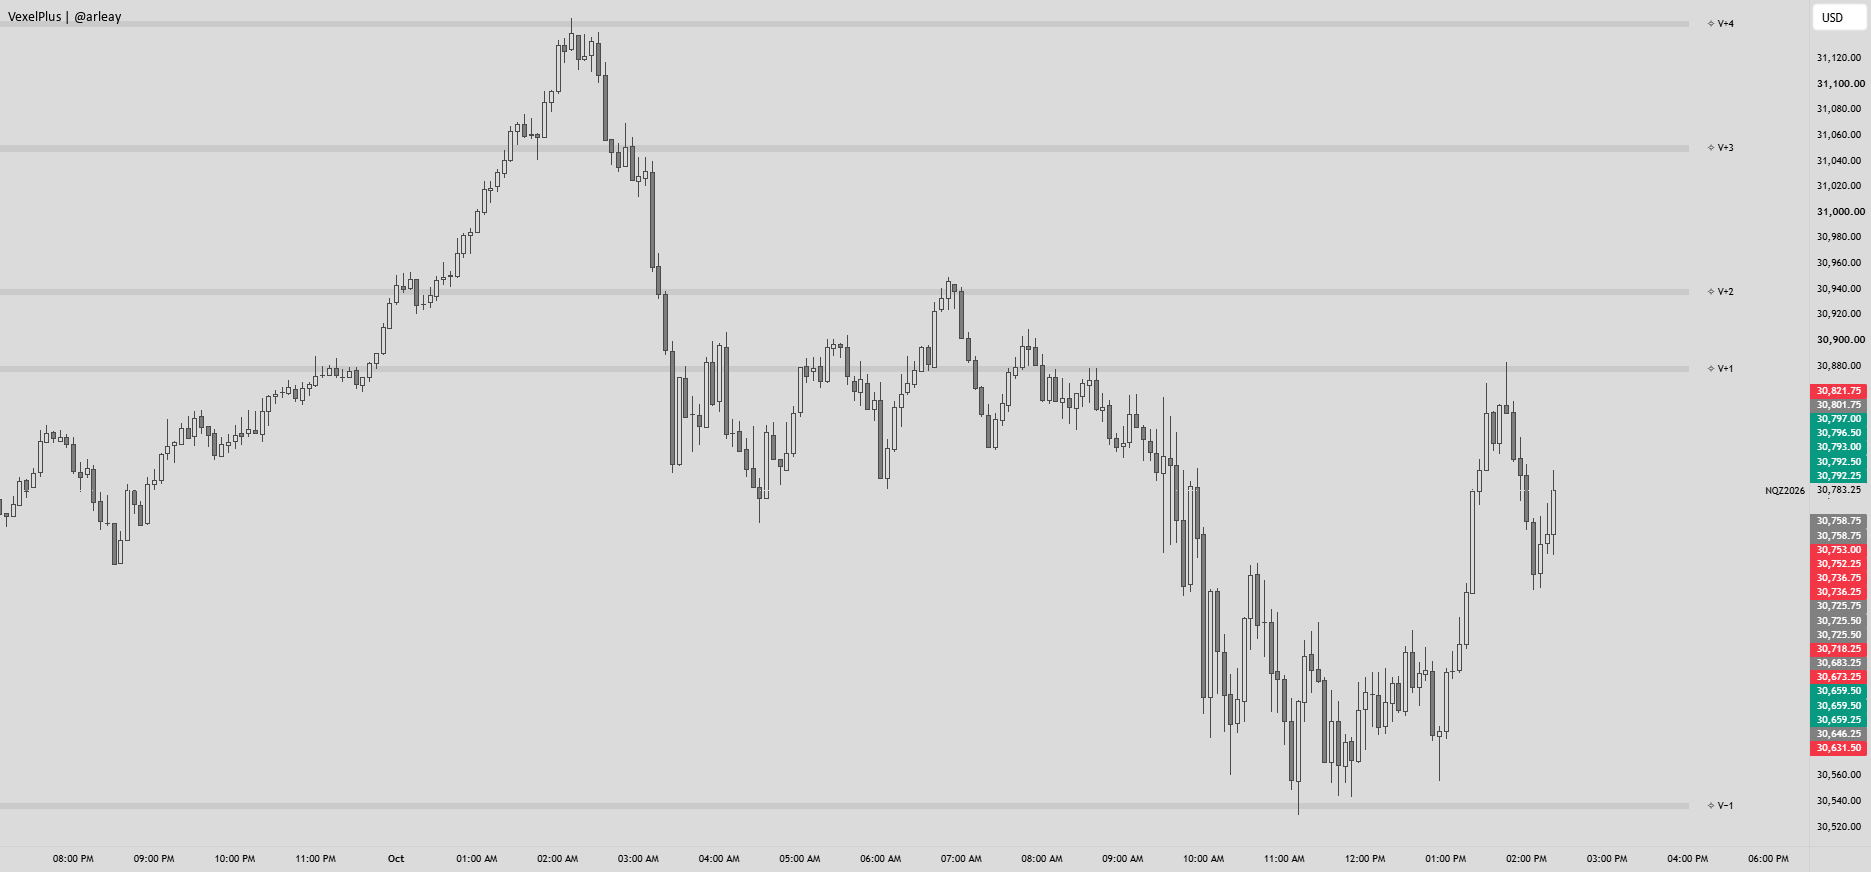
Start here
How to read and use the levels
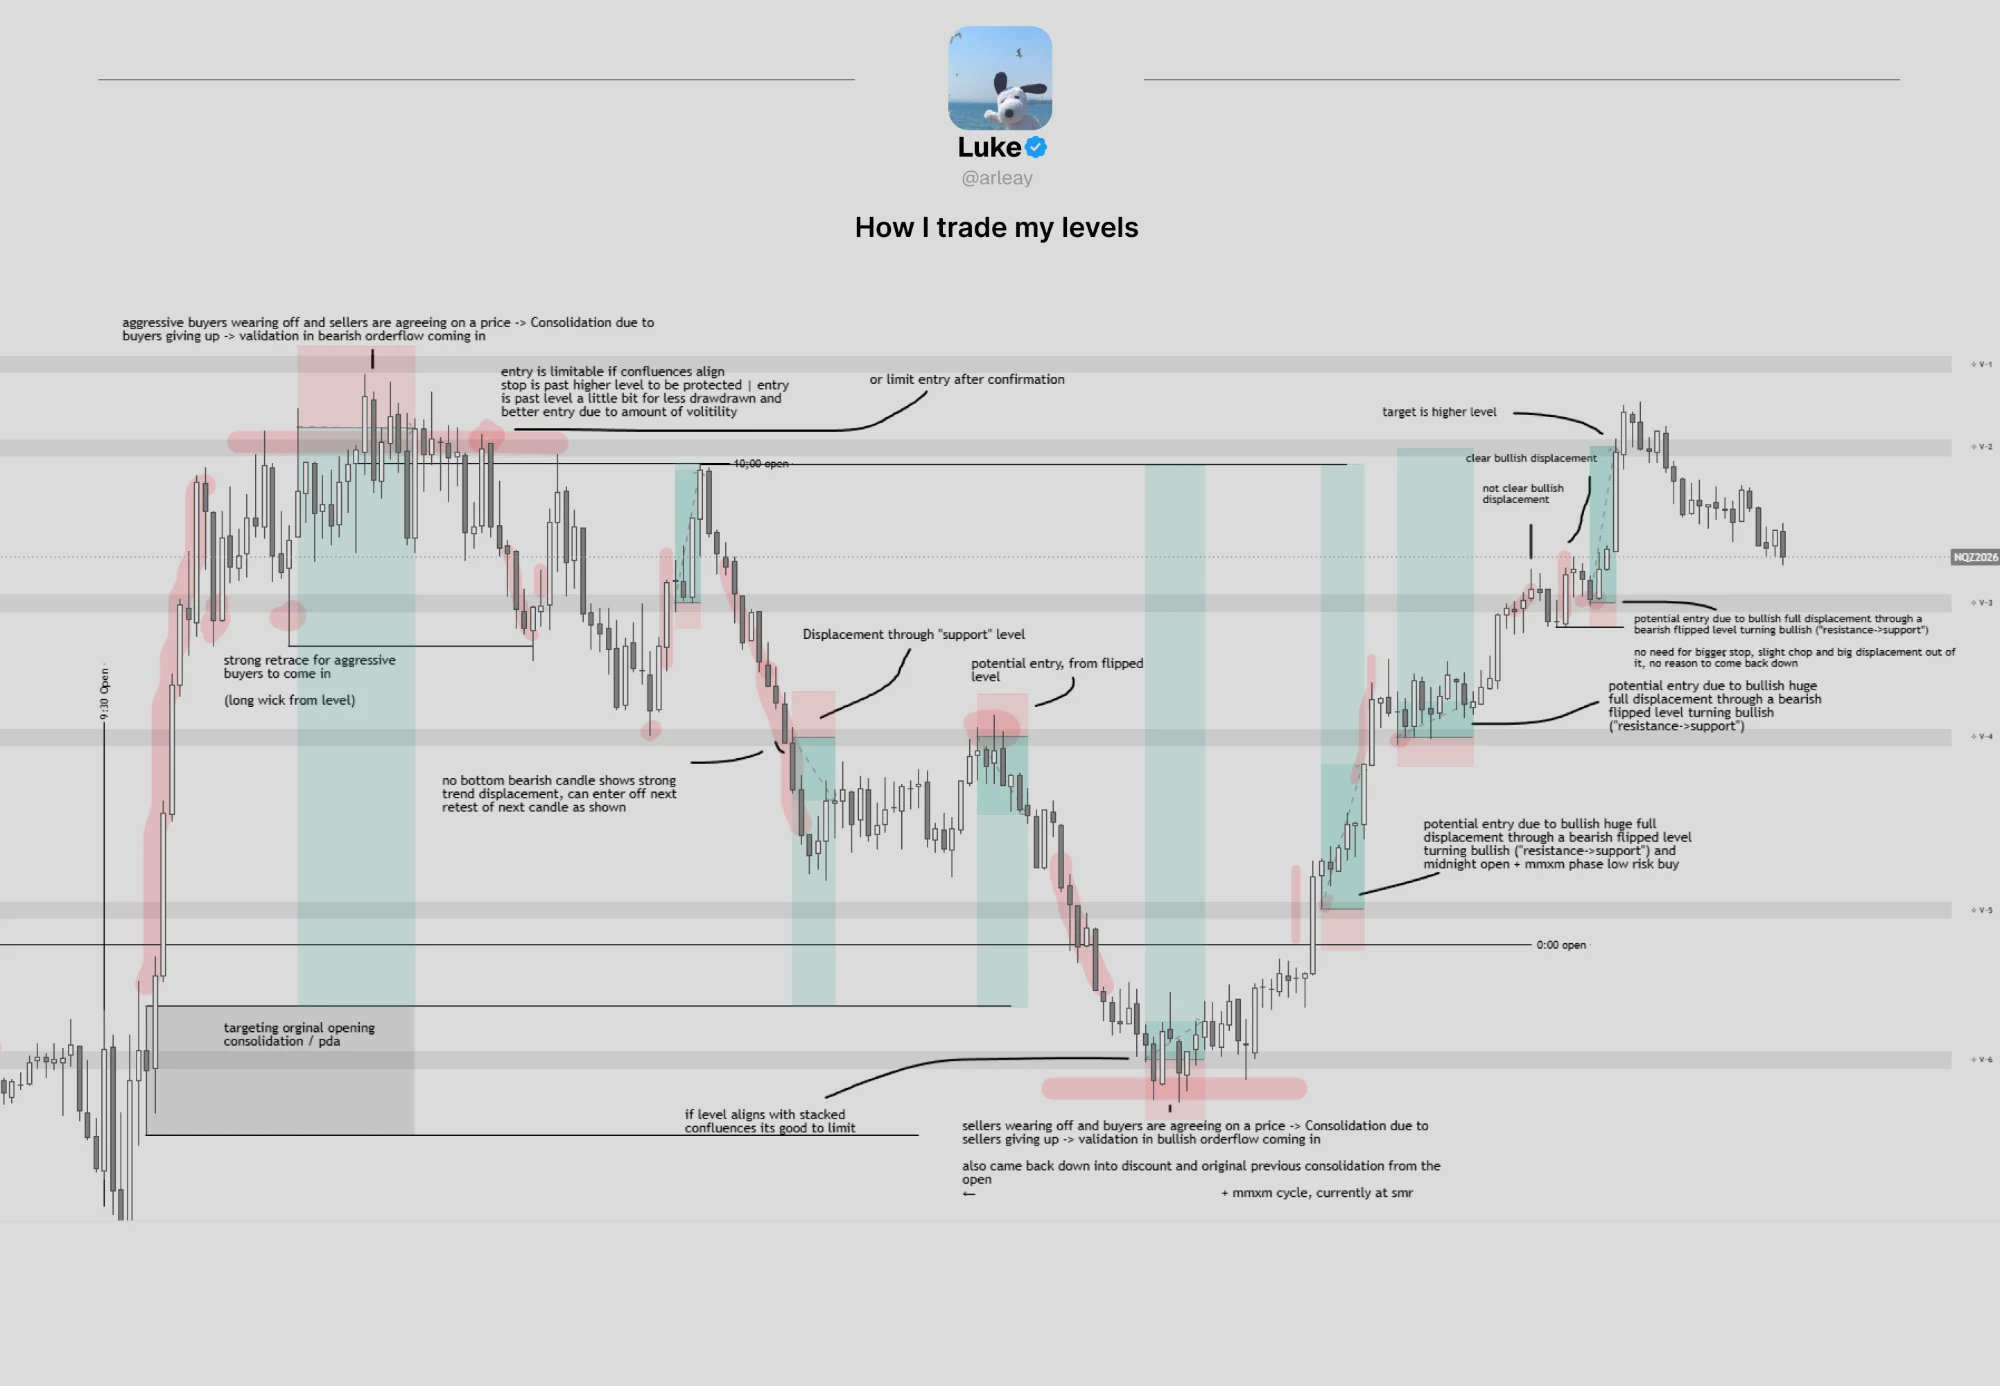
I forgot to mention, best levels are from 1m, 2m, 3m, 4m and 5m timeframe, anything higher is just added confluence. I always mainly use the 1m timeframe for these
Overview
VexelPlus plots a fresh map of probability-based reversal and retracement levels every session, anchored to the 6:00 PM futures open. The map is calculated once at the open and stays fixed for the rest of the session. It does not move with price or repaint.
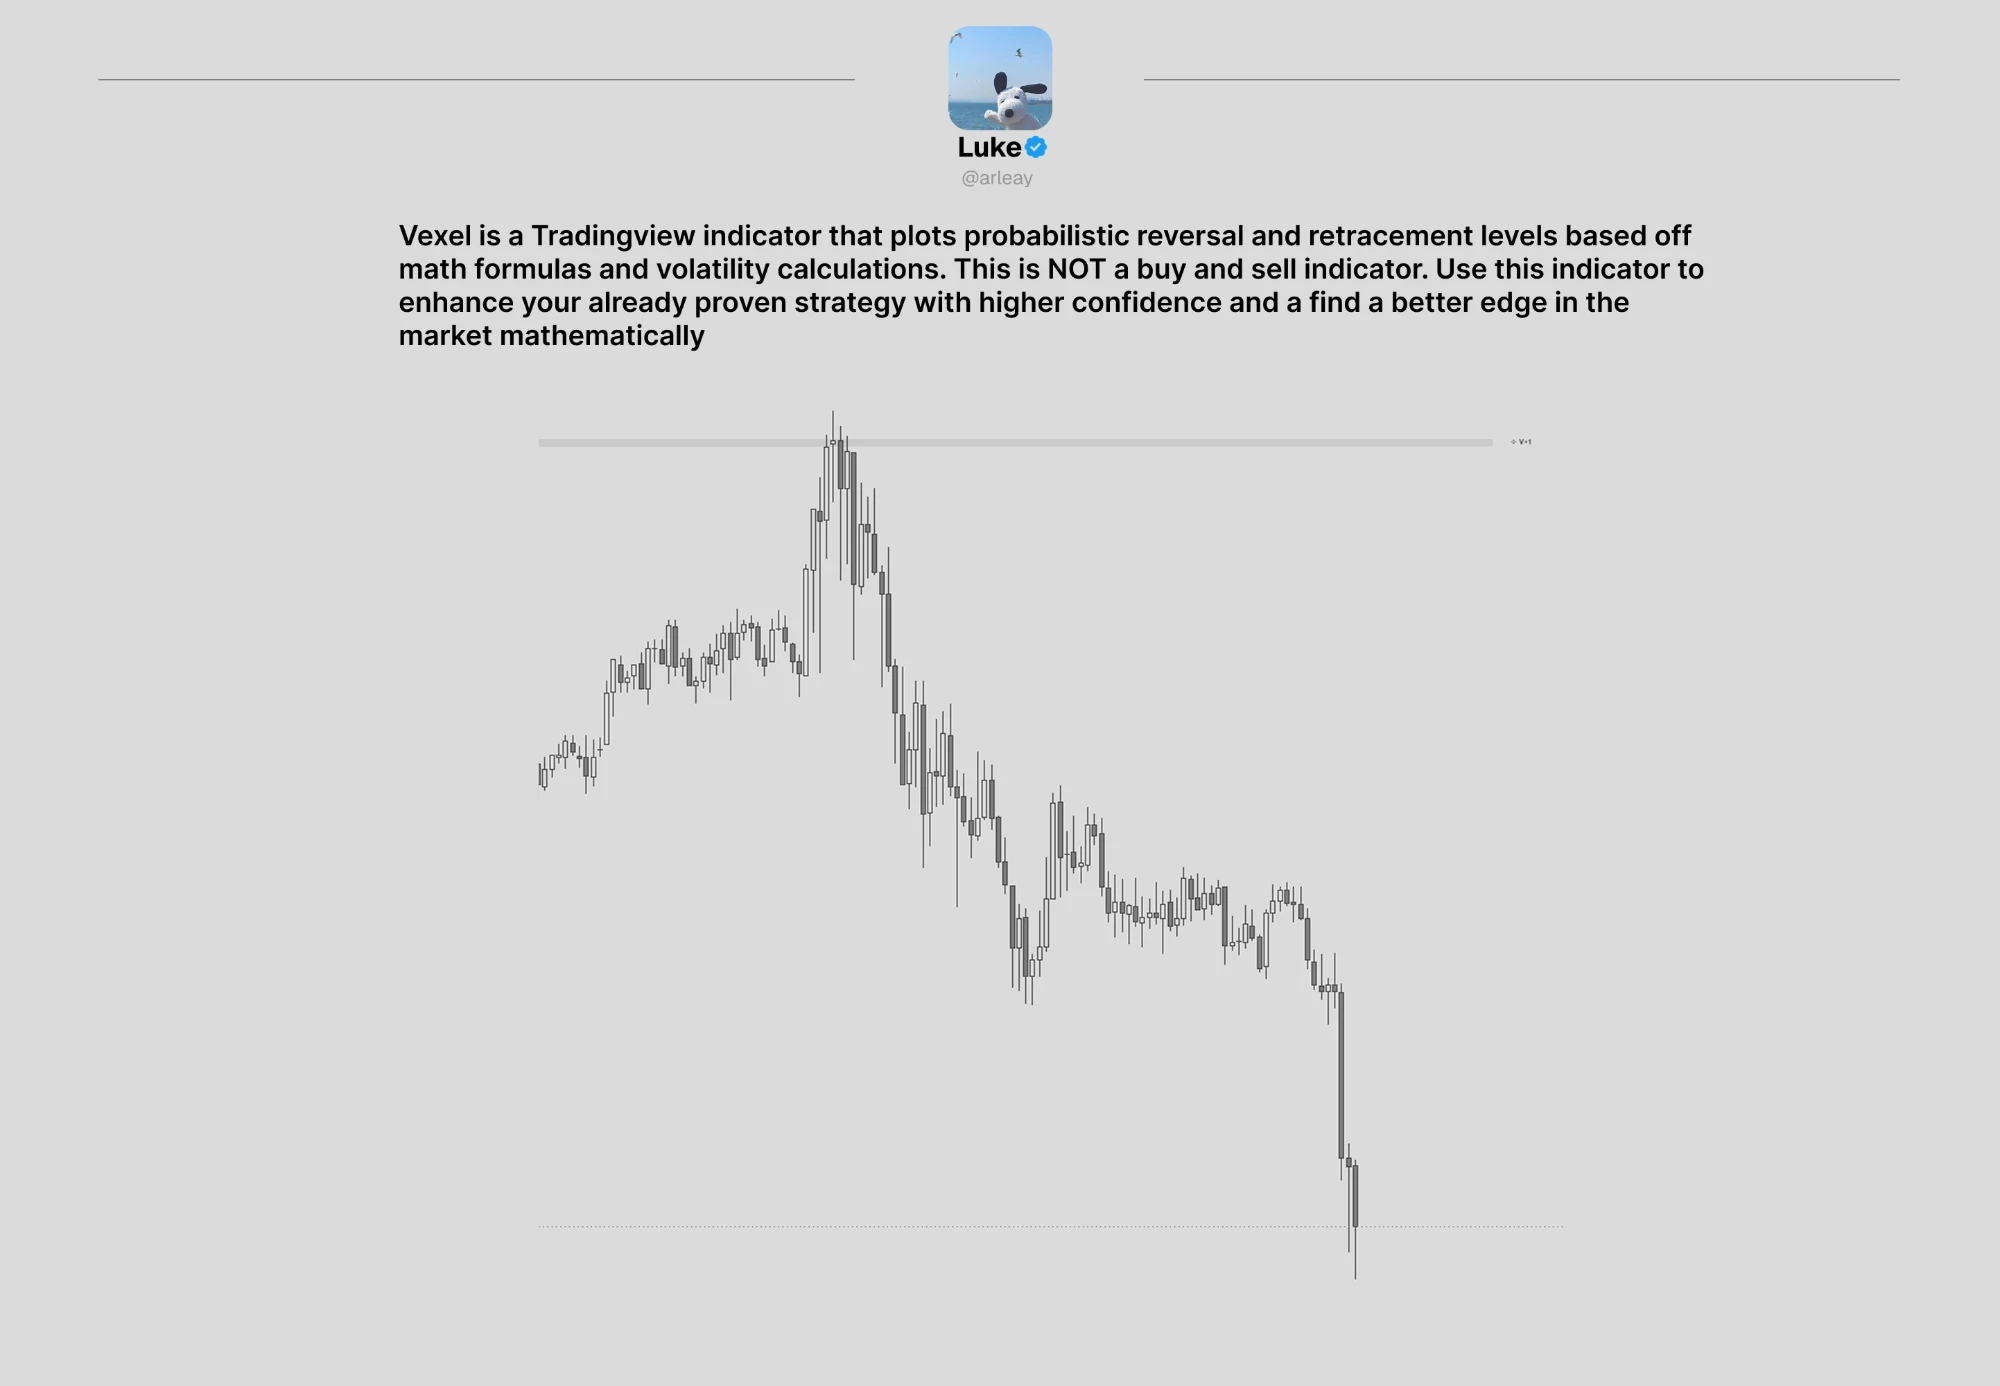
This is not a buy and sell indicator. Use the levels to add structure and confidence to a strategy you already trust.
The levels
- Six levels above the open (V+1 to V+6) and six below (V−1 to V−6).
- V±1 to V±3 cover the normal range of a session.
- V±4 to V±6 are extended, so price reaching them has moved further than usual for that day.
- Levels adapt to current market conditions every session.
Features
- Map speed: choose how quickly the map adapts (Fast, Medium, Slow).
- Map timeframe: build the map from the chart's timeframe or a higher one.
- Stacked levels: highlights prices where levels from three timeframes line up.
- Speed stacks: highlights prices where the fast, medium and slow maps agree.
- All speed maps: show the full fast, medium and slow maps together.
- Prior-session levels: review how price reacted to past maps.
- Level tap alerts: get alerted when price reaches any level you choose.
- Setups (optional): marks first-touch and retest setups on the levels (VX+ • / VX− •), with optional position boxes and SL / TP lines.
How to use it
- Best on index futures (NQ / MNQ) on the 1m to 5m charts.
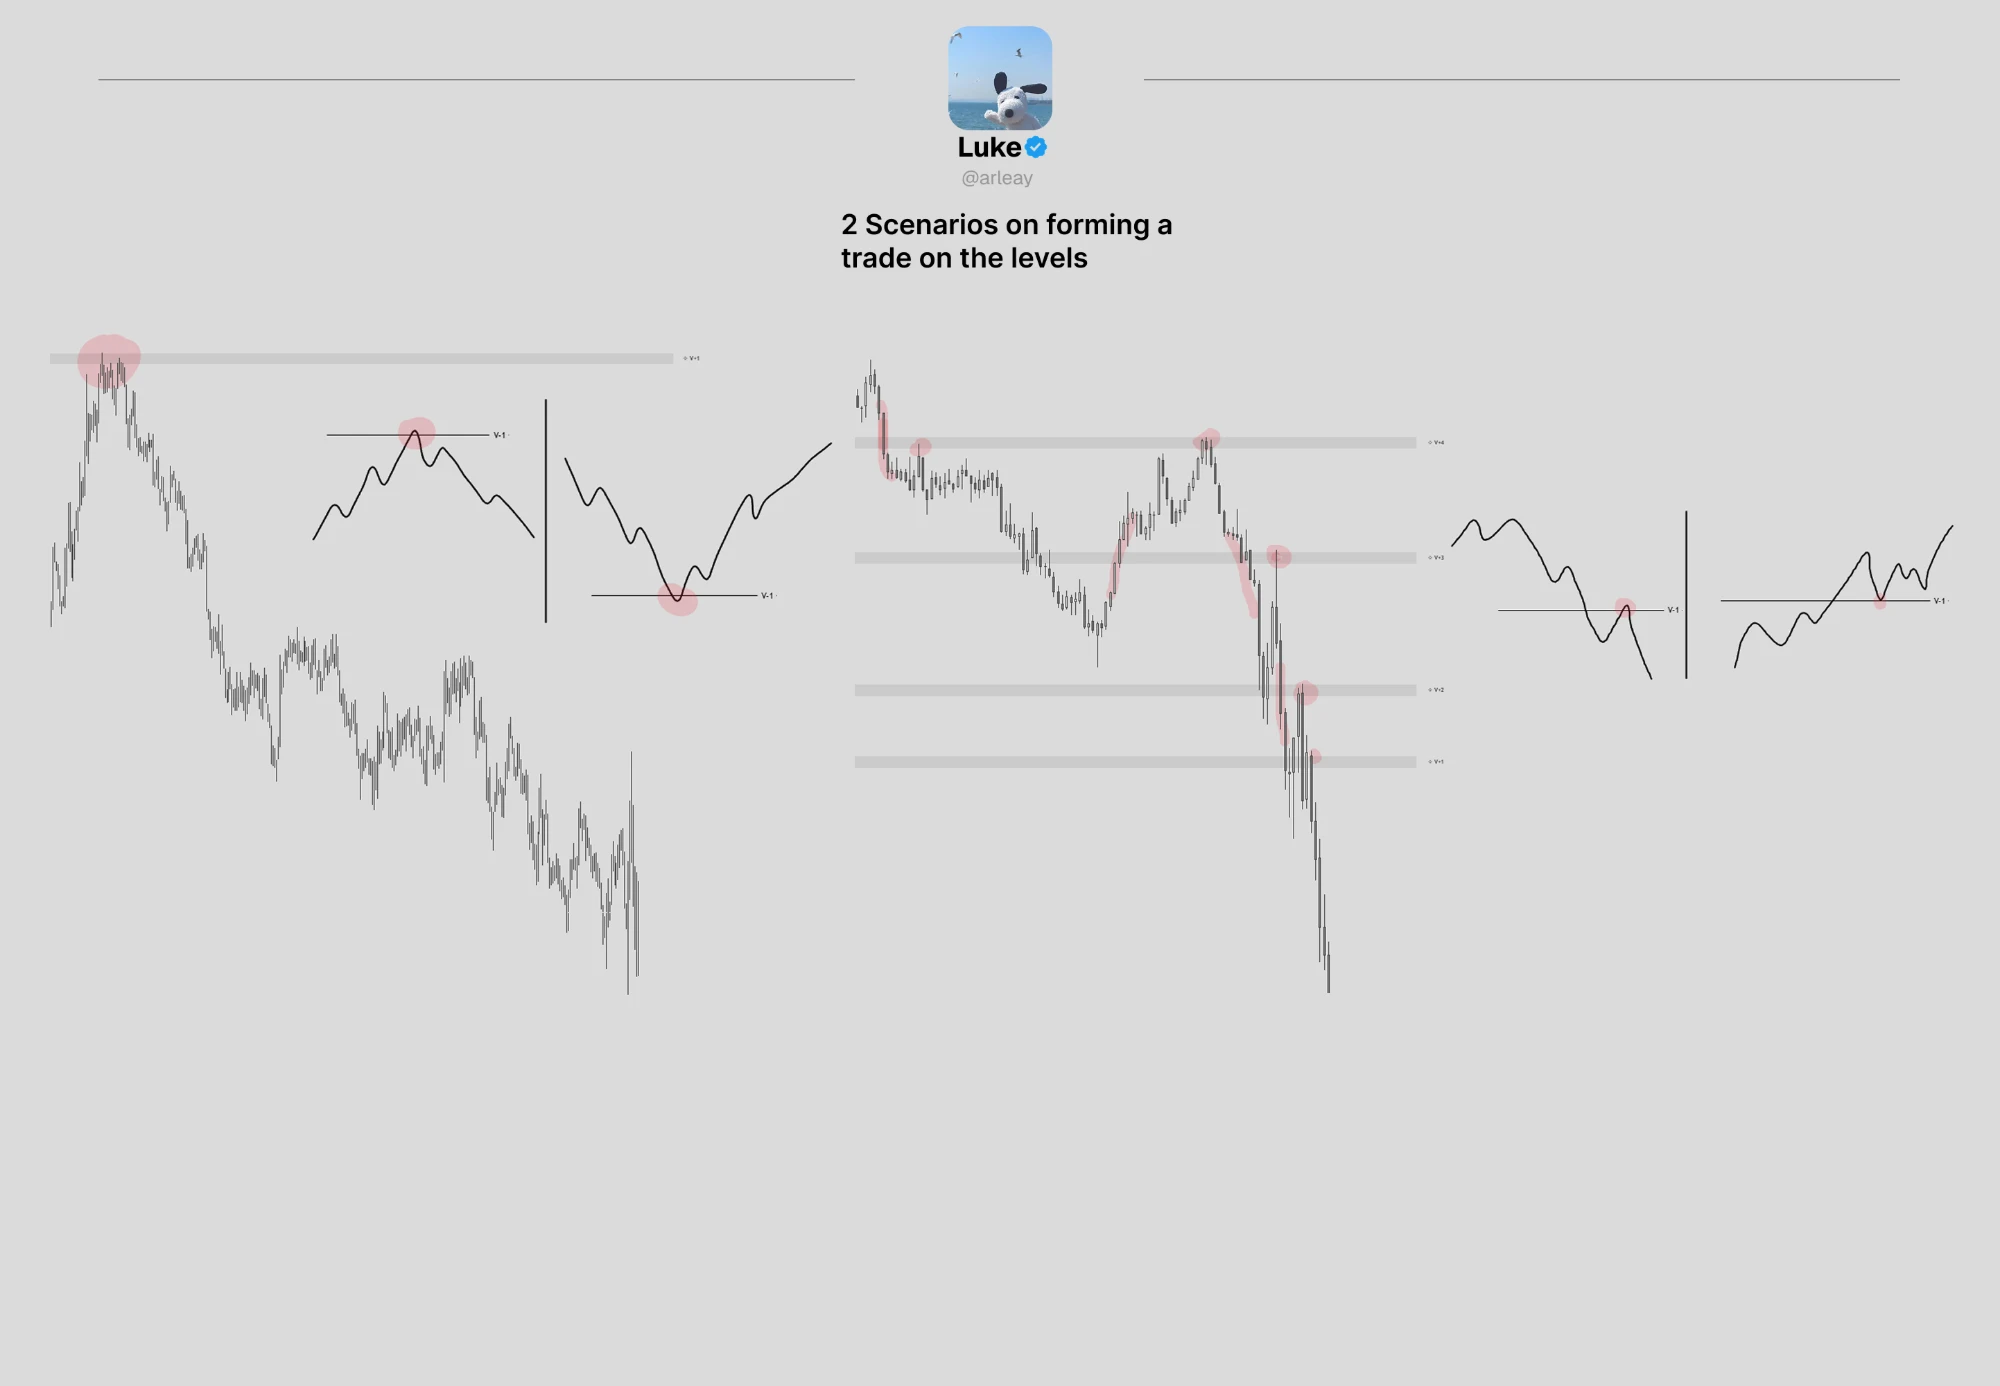
- Look for price to react at a level, such as a rejection or a shift in structure, before acting, rather than placing blind orders.
- Trade in the direction of the higher-timeframe trend where possible.
- The strongest hours are usually 3:00 AM to 12:00 PM NY. Lunch (12:00–2:00 PM) is the weakest.
- Avoid fading straight into a fast, one-directional move, and be careful around major news.
For educational purposes only. Not financial advice. Past behaviour at these levels does not guarantee future results. Always use your own risk management.