
Market structure · Pine Script v6
Downloads —
Yellow Box Range
A projected range for each session, built from how far 60 minute candles stretched away from an anchor price over the last 50 sessions. It marks where price broke, rejected or retested the levels and counts how often past sessions reached each one.
Overview
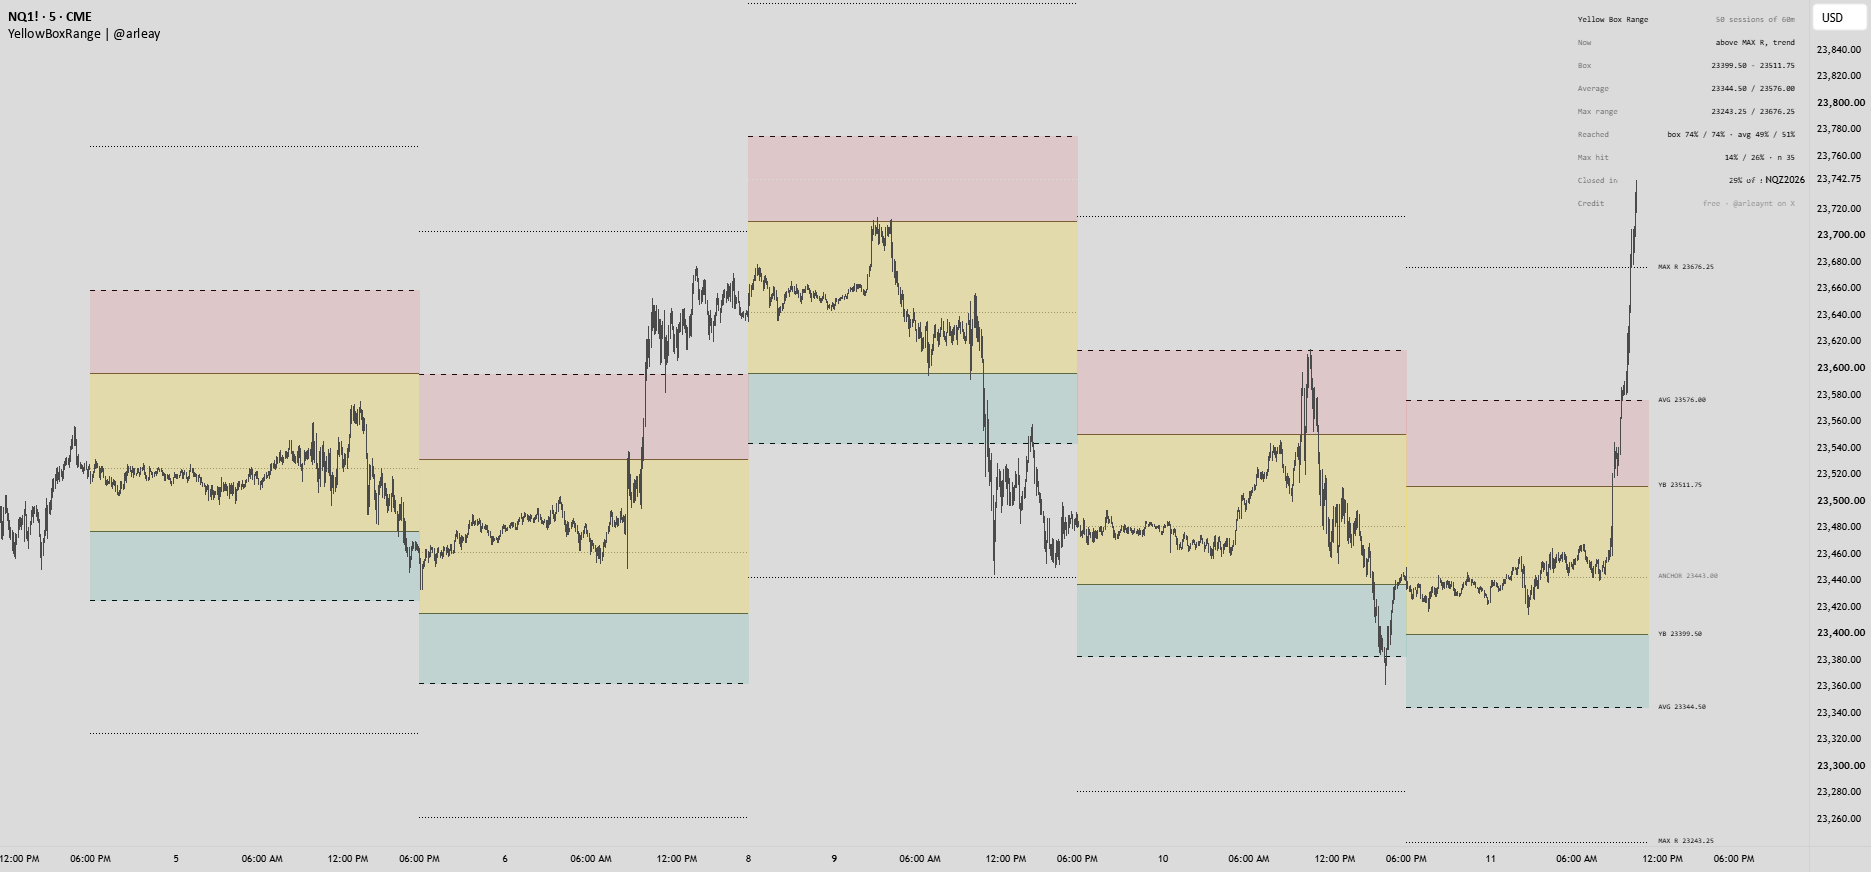
Yellow Box Range projects an expected range for each session from how far 60 minute candles have stretched away from an anchor price over the last 50 sessions. The yellow box is the zone where most hourly highs and lows stayed. The average range marks how far breaks of the box have typically gone, and the max range marks the extreme end of the sample. The rest of the indicator marks where price broke, rejected or retested those levels, and counts how often past sessions reached each one.
How it works
- Anchor. At the start of each session (18:00 New York on futures) an anchor price is set. The default is the prior session close, and the session open is also available. It does not change during the session.
- Stretches. For every 60 minute candle in the last 50 sessions, the script stores the up stretch (high minus anchor) and the down stretch (anchor minus low). Each session uses its own anchor.
- Yellow box. The 70th percentile of each side. About 70% of hourly highs stayed under the top and 70% of hourly lows stayed above the bottom.
- Average range. The median of the stretches that went past the box. Half of those breaks went further, half did not.
- Max range and max trend. Max range is the 95th percentile of all stretches. Max trend is the largest single stretch in the sample.
- Levels use completed sessions only and are fixed for the whole session. Nothing is recalculated on later bars.
Marks
- YB▲ / YB▼: the first close beyond the box.
- AVG▲ / AVG▼: a close beyond the average range.
- MAX R▲ / MAX R▼: a close beyond the max range.
- AVG ✕: a candle reaches the average range, closes back inside and closes against the move.
- back in: a close back inside the box after a break.
- RETEST: after a break, a candle touches the box edge and closes back outside it.
Marks are off by default and can be turned on in Breaks settings. By default a level counts as broken only on a candle close beyond it. With the option off, a wick is enough.
What you see
- The yellow box with shaded average range zones above and below, plus max range and max trend lines.
- Minimal view for today, Full view for past sessions.
- Labels with optional prices, and break, rejection and retest marks tied to the levels they describe.
- A panel showing where price is now relative to the box, today's levels, how often past sessions reached each level and how often they closed inside the box, with the sample size.
Settings
- Levels: days of hourly data, anchor, box holds, max range.
- Breaks: break needs a close beyond, mark breaks and rejections, max marks.
- Display: view, sessions shown in full view, shade average range zones, max trend lines, labels, prices.
- Style, panel position and text size.
Notes
- Use it on futures or other symbols that trade in sessions, on charts of 60 minutes or lower. A 1 to 5 minute chart is best for reading closes against the levels.
- The first session needs 5 sessions of history before levels appear. TradingView limits intraday history, so on lower timeframes the sample may be shorter than 50 sessions.
- The percentiles describe past stretches. A session can break any of the levels. The reach and closed-inside rates are descriptive counts, not a measure of a trade result.
- Not suitable for Heikin Ashi, Renko, Kagi, Point & Figure, Line Break or Range charts.
- This is a free script and nothing here is financial advice.